
Add to Cart
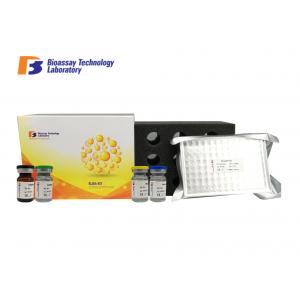
High Precision and Specificity Rat 96 Wells FTA ELISA Kit For
Accurate Quantitative Detection
Cat.No E1070Ra
Standard Curve Range: 0.05mmol/L - 10mmol/L
Sensitivity: 0.021mmol/L
Assay Principle
This kit is an Enzyme-Linked Immunosorbent Assay (ELISA). The plate
has been pre-coated with Rat FTA antibody. FTA present in the
sample is added and binds to antibodies coated on the wells. And
then biotinylated Rat FTA Antibody is added and binds to FTA in the
sample. Then Streptavidin-HRP is added and binds to the
Biotinylated FTA antibody. After incubation unbound
Streptavidin-HRP is washed away during a washing step. Substrate
solution is then added and color develops in proportion to the
amount of Rat FTA. The reaction is terminated by addition of acidic
stop solution and absorbance is measured at 450 nm.
Reagent Provided
| Components | Quantity |
| Standard Solution (14.4mmol/L) | 0.5ml x1 |
| Pre-coated ELISA Plate | 12 * 8 well strips x1 |
| Standard Diluent | 3ml x1 |
| Streptavidin-HRP | 6ml x1 |
| Stop Solution | 6ml x1 |
| Substrate Solution A | 6ml x1 |
| Substrate Solution B | 6ml x1 |
| Wash Buffer Concentrate (30x) | 20ml x1 |
| Biotinylated Rat FTA Antibody | 1ml x1 |
| User Instruction | 1 |
| Plate Sealer | 2 pics |
| Zipper bag | 1 pic |
Reagent Preparation
All reagents should be brought to room temperature before use.
Standard Reconstitute the 120μl of the standard (14.4mmol/L) with 120μl of
standard diluent to generate a 7.2mmol/L standard stock solution.
Allow the standard to sit for 15 mins with gentle agitation prior
to making dilutions. Prepare duplicate standard points by serially
diluting the standard stock solution (7.2mmol/L) 1:2 with standard
diluent to produce 3.6mmol/L, 1.8mmol/L, 0.9mmol/L and 0.45mmol/L
solutions. Standard diluent serves as the zero standard(0 mmol/L).
Any remaining solution should be frozen at -20°C and used within
one month. Dilution of standard solutions suggested are as follows:
| 7.2mmol/L | Standard No.5 | 120μl Original Standard + 120μl Standard Diluent |
| 3.6mmol/L | Standard No.4 | 120μl Standard No.5 + 120μl Standard Diluent |
| 1.8mmol/L | Standard No.3 | 120μl Standard No.4 + 120μl Standard Diluent |
| 0.8mmol/L | Standard No.2 | 120μl Standard No.3 + 120μl Standard Diluent |
| 0.4mmol/L | Standard No.1 | 120μl Standard No.2 + 120μl Standard Diluent |
| Standard Concentration | Standard No.5 | Standard No.4 | Standard No.3 | Standard No.2 | Standard No.1 |
| 14.4mmol/L | 7.2mmol/L | 3.6mmol/L | 1.8mmol/L | 0.9mmol/L | 0.45mmol/L |
Wash Buffer Dilute 20ml of Wash Buffer Concentrate 30x into deionized or
distilled water to yield 500 ml of 1x Wash Buffer. If crystals have
formed in the concentrate, mix gently until the crystals have
completely dissolved.
Assay Procedure
1. Prepare all reagents, standard solutions and samples as
instructed. Bring all reagents to room temperature before use. The
assay is performed at room temperature.
2. Determine the number of strips required for the assay. Insert
the strips in the frames for use. The unused strips should be
stored at 2-8°C.
3. Add 50μl standard to standard well. Note: Don’t add antibody to standard well because the standard solution
contains biotinylated antibody.
4. Add 40μl sample to sample wells and then add 10μl anti-FTA
antibody to sample wells, then add 50μl streptavidin-HRP to sample
wells and standard wells (Not blank control well). Mix well. Cover
the plate with a sealer. Incubate 60 minutes at 37°C.
5. Remove the sealer and wash the plate 5 times with wash buffer.
Soak wells with at least 0.35 ml wash buffer for 30 seconds to 1
minute for each wash. For automated washing, aspirate all wells and
wash 5 times with wash buffer, overfilling wells with wash buffer.
Blot the plate onto paper towels or other absorbent material.
6. Add 50μl substrate solution A to each well and then add 50μl
substrate solution B to each well. Incubate plate covered with a
new sealer for 10 minutes at 37°C in the dark.
7. Add 50μl Stop Solution to each well, the blue color will change
into yellow immediately.
8. Determine the optical density (OD value) of each well
immediately using a microplate reader set to 450 nm within 10
minuets after adding the stop solution.
Calculation of Result
Construct a standard curve by plotting the average OD for each
standard on the vertical (Y) axis against the concentration on the
horizontal (X) axis and draw a best fit curve through the points on
the graph. These calculations can be best performed with
computer-based curve-fitting software and the best fit line can be
determined by regression analysis.
